A Window of Opportunity: Gift Planning and the LGBTQ Community
In 2013, the first version of this paper was published in Advancing Philanthropy. With the 2015 US Supreme Court ruling in Obergefell v. Hodges securing

In 2013, the first version of this paper was published in Advancing Philanthropy. With the 2015 US Supreme Court ruling in Obergefell v. Hodges securing
Download this free guide to gain insights on: What is a Feasibility Study? Is it the same as a Campaign Planning Study? How is the

Download this free guide to learn answers to: For more information, follow our blog.

Download this free guide to learn answers to: Which type of fundraising consultant best suits your needs? When should you hire a fundraising consultant? What

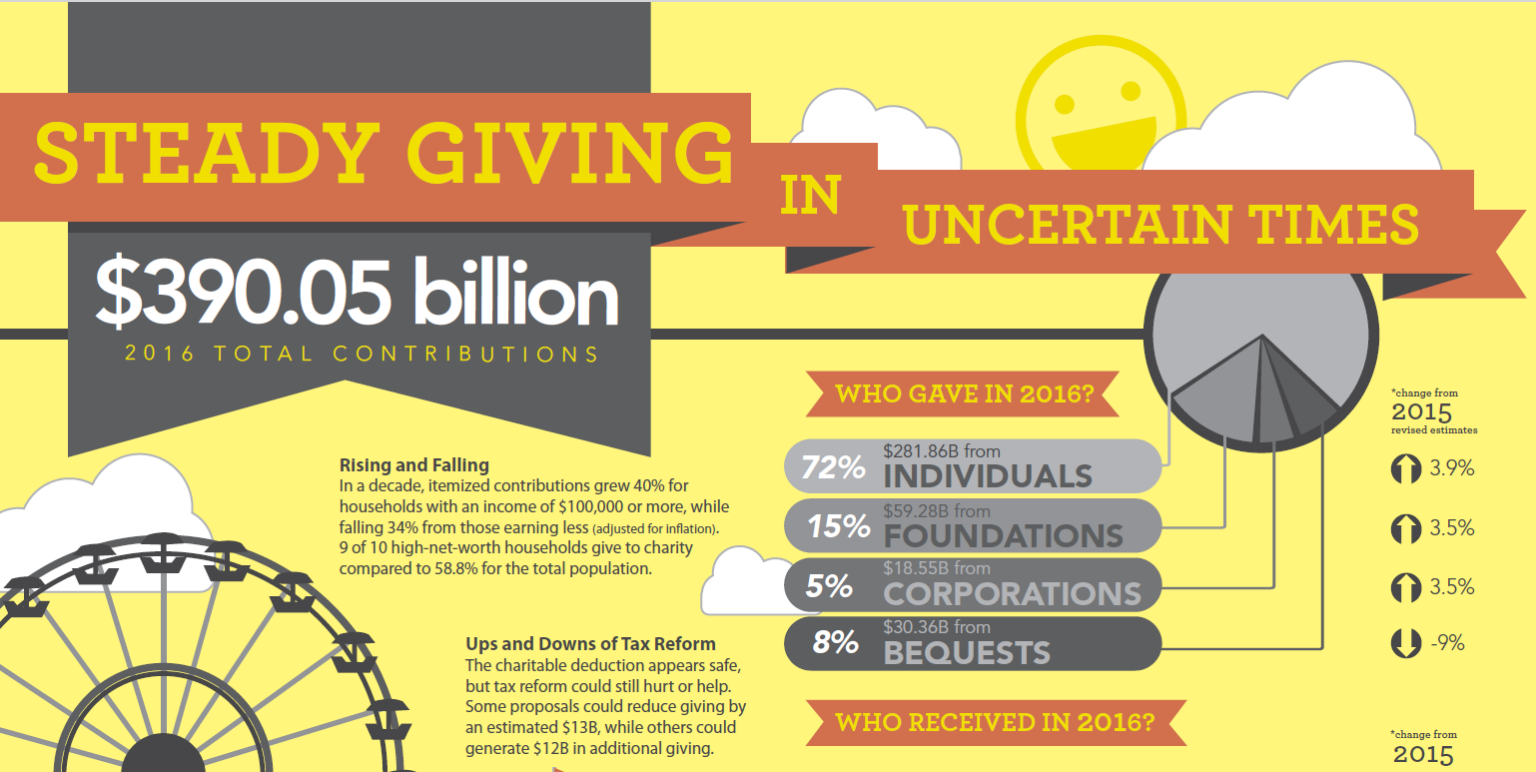
Giving USA 2017: The Annual Report on Philanthropy©, is the longest running, most comprehensive report on philanthropy in America. The Report shows 2016 with steady

In our work with hospitals, the topic of “grateful patient and family programs” comes up often. They have the potential to be a meaningful source

Q: Why is leadership transition so important? A: Identifying and recruiting the leadership most suitable to your mission and culture is critical to a successful
Get in touch with us using the form below or by calling us directly at 1-614-437-3000. We look forward to speaking with you!


450 South Front Street, Columbus, OH 43215
1-614-437-3000 • 1-877-437-3711
[email protected]
Sitemap
Insights
© 2023 Benefactor Group • Privacy & Terms