
Giving USA Infographic 2026: Hustle and Bustle
Just released! Giving USA 2026: The Annual Report on Philanthropy©, the nation’s longest-running and most comprehensive study of charitable giving is here. Now in its 14th year, our Annual Infographic runs with the hustle and bustle theme because, frankly, 2025 never gave the sector a quiet moment. Click to explore more of Benefactor Group’s whimsical Giving USA infographic and see how 2025 kept the philanthropic skyline under constant construction.
Giving USA 2025: Fair Conditions for Giving
Today marks the 2025 release of Giving USA: The Annual Report on Philanthropy©, the longest running, most comprehensive report on philanthropy in America.
Giving USA 2024: Competing Factors Shape Giving
Today marks the 2024 release of Giving USA: The Annual Report on Philanthropy©, the longest running, most comprehensive report on philanthropy in America.
Giving USA 2023: A Mixed Bag
It’s here! Giving USA 2023: The Annual Report on Philanthropy©, the longest running, most comprehensive report on philanthropy in America.
Our 11th Annual Infographic interprets this data to help donors, fundraisers, and nonprofit leaders understand trends and navigate present-day philanthropy.
Giving USA 2022: Looking For Safe Harbor
Giving USA is here and we are diving into the data to see what it means for giving in 2022 and beyond.

Giving USA 2021: Serving Up Uncommon Generosity
Giving USA is here and we are diving into the data to see what it means for giving in 2021 and beyond.
Giving USA 2020: A Very Bountiful Year In Philanthropy
Giving USA is here and we are diving into the data to see what it means for giving in 2020 and beyond.
Giving USA 2019: A Volatile Year for Philanthropy
Today marks the release of Giving USA 2019 Infographic: The Annual Report on Philanthropy©, the longest running, most comprehensive report on philanthropy in America. It
Giving USA 2018: A Stellar Year for Philanthropy
Giving USA 2018: The Annual Report on Philanthropy©, is the longest running, most comprehensive report on philanthropy in America. The Giving USA 2018 infographic shows
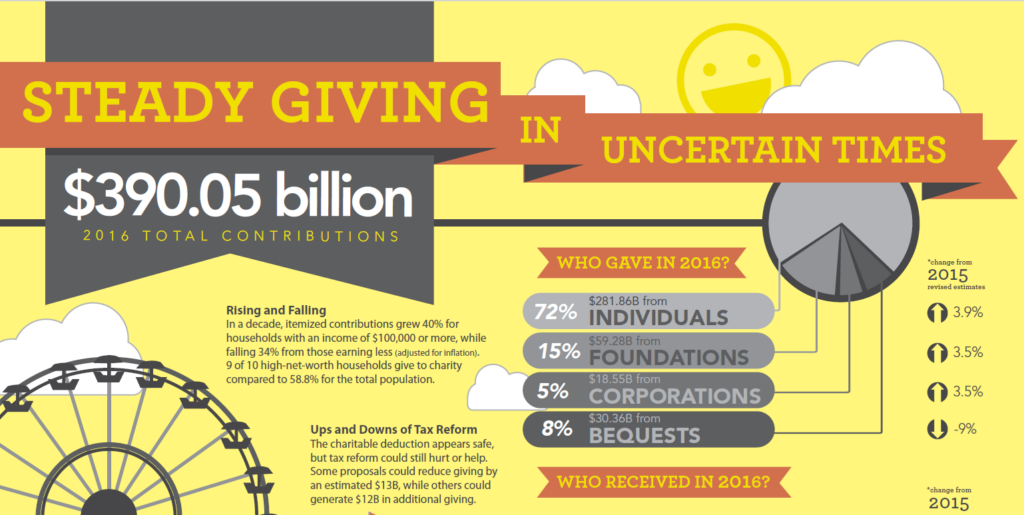
Giving USA 2017: Steady Giving in Uncertain Times
Giving USA 2017: The Annual Report on Philanthropy©, is the longest running, most comprehensive report on philanthropy in America. The Report shows 2016 with steady
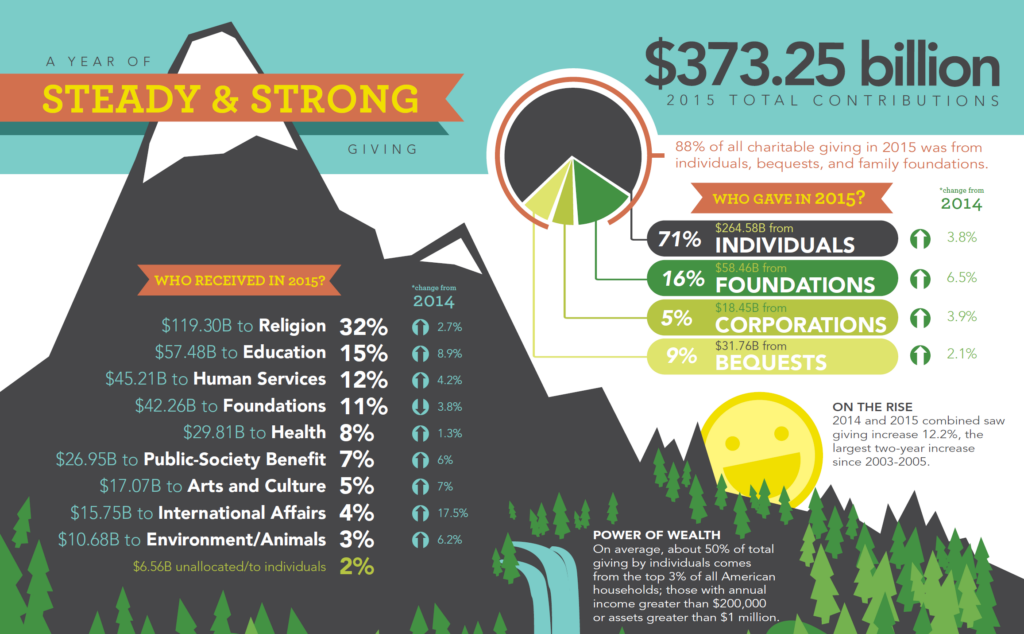
Giving USA 2016: Steady & Strong
Giving USA 2016 Inforgraphic: The Annual Report on Philanthropy©, is the longest running, most comprehensive report on philanthropy in America. The Report affirms 2015 as a

Giving USA 2015: A Year of Strong Growth
Giving USA: The Annual Report on Philanthropy is the longest running, most comprehensive report on philanthropy in America. Our Bene Graphics provide a visual interpretation
Giving USA 2014: Navigating the Seas of Giving
Giving USA: The Annual Report on Philanthropy is the longest running, most comprehensive report on philanthropy in America. Our Bene Graphics provide a visual interpretation of the trends from this report to help you navigate the seas of giving.
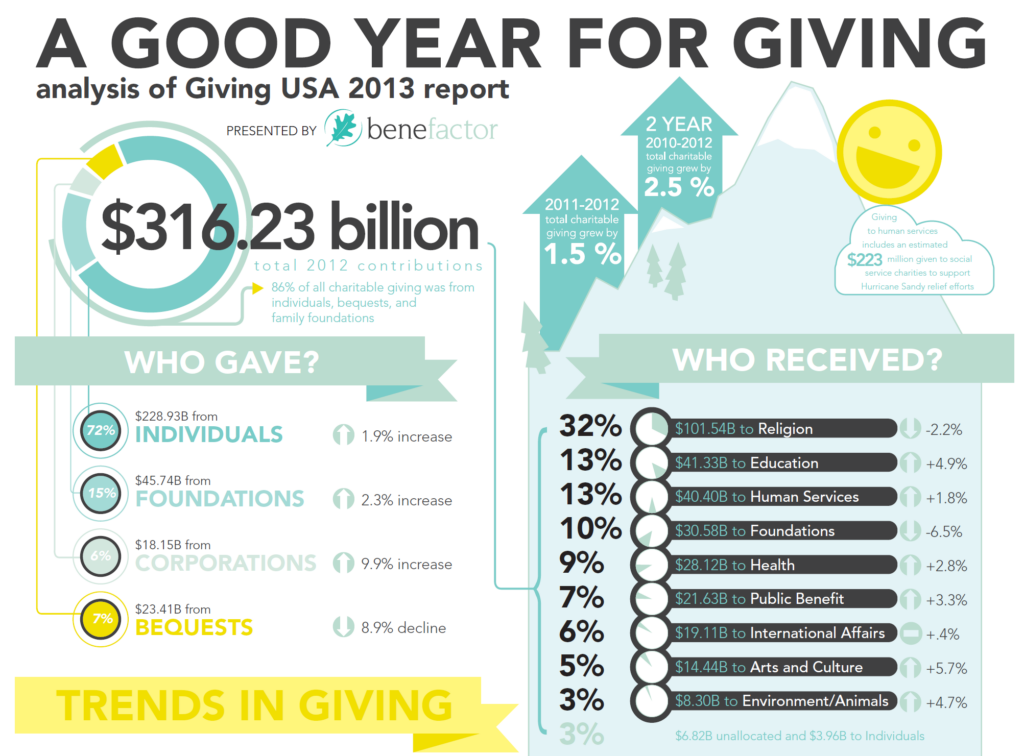
Giving USA 2013: A Good Year for Giving
Giving USA: The Annual Report on Philanthropy is the longest running, most comprehensive report on philanthropy in America. The following graphics portray the Giving USA data for 2012, as well as three interesting trends in the data, to provide new insights to help your quest of serving the common good.