cap•i•tal (n): a measure of the assets available to build a business. In general, companies with access to working capital will be more successful since they can expand and improve their operations.
What is Creative Capital and why is it important?
“Creative Capital” measures the assets that are readily available to advance the missions of artistic and cultural organizations: to create new works of enduring significance, present extraordinary exhibitions, produce grand performances, and inspire an ever-growing audience. Surely such activities have immeasurable intrinsic value— that’s why we give them tax-exempt status—but they also have concrete, measurable economic impact. The financial importance of these activities is far greater than the mere sum of organizations’ payrolls and the spending of audiences they attract. It is becoming increasingly clear that creativity itself is an essential ingredient in a community’s prosperity.
“Creativity has become the global gold standard for economic growth,” according to Alan M. Webber, founding editor of Fast Company magazine. Creativity guru Richard Florida asserts that the creative class now comprises more than 30% of the workforce. He states that “the choices these people make has already had a huge economic impact and in the future will determine which companies will prosper or go bankrupt and even which cities will thrive or wither.”
Can Columbus attract and retain creative people sufficient to realize our artistic, cultural, and economic aspirations? To do so, we must compete with other communities—cities like Charlotte, Cincinnati, Cleveland, Indianapolis, Milwaukee, and St. Louis. Many variables will determine how each community fares in its effort to build an economically powerful creative class. Mr. Florida cites at least three: innovative employers, a lively urban core, and a dynamic ‘arts scene.’ We focused on just one of these critical factors: the assets available to sustain and expand Columbus’ dynamic arts environment.
What did we measure?
When a company seeks working capital to build its business, it has a variety of options to consider: debt or equity financing, venture capital, even ‘bootstrapping’ (which any entrepreneur will cite as the most precarious path to navigate successfully).
In order to determine the ‘creative capital’ available to energize a dynamic arts environment in Columbus (in comparison with the six cities mentioned above), we attempted to identify the financial resources that are consistently available to nonprofit arts organizations, specifically organizational endowments and foundation assets devoted to arts and culture…because just as creativity is the gold standard for economic growth, endowments and foundations are the gold standard of art institutions’ stability and growth. Without endowment and foundation assets, the arts are relegated to the functional equivalent of ‘bootstrapping,’ and their prospects for sustained success are precarious at best.
Surely Columbus arts organizations have enjoyed critical successes—BalletMet’s acclaimed performances at the Joyce Theatre, the Museum of Art’s notable exhibition Circle of Bliss, the reinstatement of the annual Thurber Prize. But can this level of performance be sustained with the equivalent of ‘bootstrap’ funding? Or are these isolated bright spots that will become increasingly rare as our arts organizations refocus their resources on day-to-day survival?
We identified six comparable communities to help benchmark Columbus’ level of creative capital. In each city, we utilized IRS 990 data to identify all arts and cultural organizations with annual operating budgets of $100,000 or more. And in each city we identified all foundations with a self-proclaimed interest in arts, culture, or the humanities. As a result, we found 265 nonprofit organizations and 348 foundations and began to calculate and analyze the creative capital they contributed to their respective communities.
Table 1: Count of population, arts organizations, and foundations (based on 2003- 2004 estimates)
For a thorough description of the methods used to collect this data please refer to the endnotes.
How did Columbus fare?
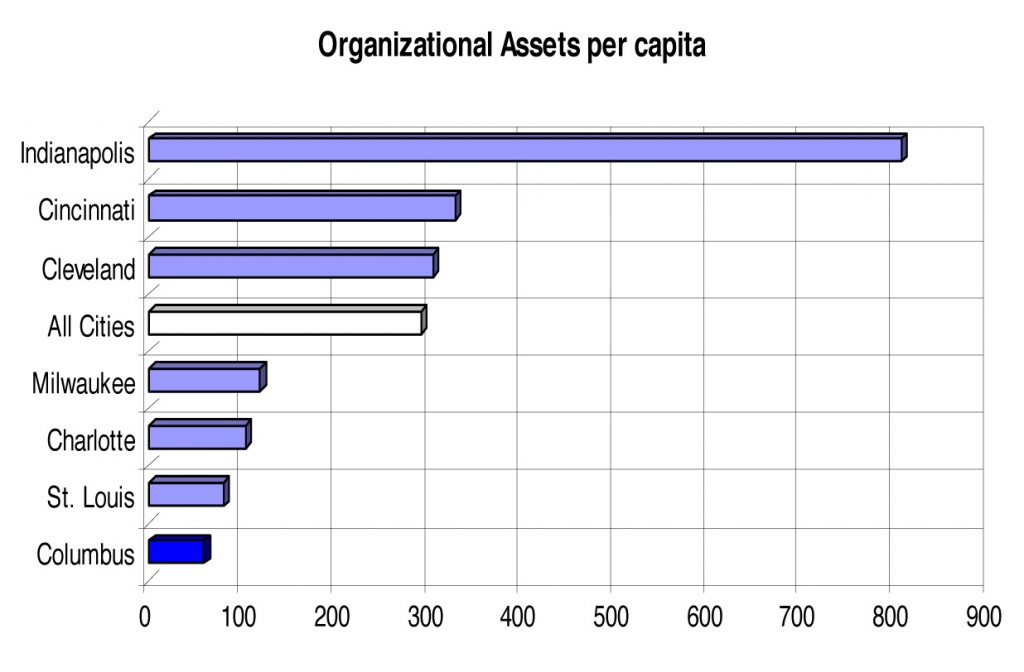
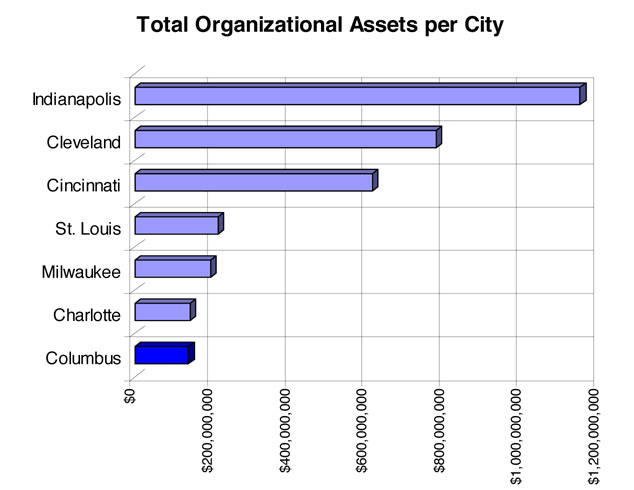
Poorly. Whether measured in outright dollars, dollars per organization, or dollars per capita, Columbus ranked at or near the bottom of every measure of creative capital. (The complete tables of each city’s organizational assets can be found in the appendix.)
 Consider, for example, organizational endowments. Arts organizations across the country have built sizeable endowments. Most are the result of contributions from visionary individuals— either during their lifetimes or as a result of their estates; people like Enid Smith Goodrich, who died in November 1996 at age 93.
Indianapolis’ Museum of Art and Children’s Museum each received about $40 million from her estate. Goodrich was the widow of Pierre Goodrich, who amassed wealth through various investments, including 20% ownership of the parent company of the Indianapolis News and the Indianapolis Star. Enid Goodrich had been a longtime donor to the art museum, where she served as a trustee. She was also an honorary trustee of the Children’s Museum.While arts endowments have been built primarily with gifts from individual donors—most often hometown people like Enid and Pierre Goodrich who invested in the community where they lived and prospered—contributions from corporations, foundations, and the arts organizations’ retained earnings have also been a factor to a lesser degree in building endowment
Just imagine the stabilizing influence of an endowment of $40 million, providing revenue of $2.2 million year after year. Institutions that had previously devoted human and financial resources to financial concerns can now allocate more time and attention to their core missions. Audiences that were once excluded because of high admission or restricted operations can now freely access the treasures of these institutions.
An arts organization with a robust endowment providing reliable revenue has a considerable competitive advantage. Well-endowed arts organizations are far less susceptible to short-term economic cycles and unpredictable events. The revenue earned by an endowment can fund experimental programs, enable addition performances or exhibitions, provide expanded outreach programs, and otherw expand the opportunities for a public—especially members of the creative class— with growing hunger for authentic arts experiences.
Endowments might provide general unrestricted operating support, or might be designated for a particular activity. For example, an art museum with an endowed acquisition fund can seize that moment when the perfect work for its collection is suddenly available. A performing arts troupe might face a fiscal crisis when a snow storm cancels a pivotal performance—unless they have an operating endowment. In the absence of an endowment, a museum might be forced to increase ticket prices, charge more for special activities, or find other ways to increase their per capita revenue.
With a robust endowment, the opposite may occur. Admission to the permanent exhibition at the Cincinnati Art Museum is now free, thanks to a gift of $2.15 million from Richard and Lois Rosenthal. The couple was inspired by their own childhood experiences at art museums and wanted others in the community to have the same opportunities.
Research conducted by the National Endowment for the Arts found that classical ballet companies (most of which lack endowments) faced economic hardships during the recession of 1990-1991 and needed an average of six years to recover while their artistic production languished.
The economies of managing a museum, a performing arts troupe, or other cultural institution are no different in Columbus than the cost of conducting similar activities in the other comparable cities. Yet the managers of art organizations in Columbus’ peer cities have a considerable ‘head start’ each year, judging by the endowment assets available. Just imagine the transformational impact that an endowment of $40 million might have when entrusted to the Board of one of our museums or arts organizations. Arts organizations in cities like Cleveland and Cincinnati, with organizational assets of more than $300 per resident, can be more accessible and more creative. In Columbus, the lack of organizational assets restricts creativity and forces organizations to rely more heavily on ticket sales and annual donations.
Foundation Support for the Arts
Endowments are not the only reservoir of creative capital. Across America, visionary philanthropists (and ordinary people) have placed their assets in foundations, including community foundations, to carry out philanthropic aspirations during their lifetimes and beyond. Similarly, corporations have established foundations to facilitate their charitable activities. According to the Foundation Center, private and community foundations now hold assets of $440 billion—and pay out approximately 5.5% of their value each year in support of worthy causes. On average, foundations devote approximately 12% of their giving to arts and culture, which means that foundations are a repository of nearly $52 billion in creative capital nationally, yielding nearly $3 billion in reliable revenue each year.
Some foundations bear the name of America’s great industrialists, like Ford, Mellon, Lilly, and Packard; but most were created by the kind of people described in the seminal book The Millionaire Next Door. These philanthropists earned their money in one or two generations through entrepreneurial ventures. From 1993 to 2003, they fueled a 77% increase in the number of private foundations; today a total of 66,400 foundations support worthy nonprofit endeavors.
However, foundation assets are distributed disproportionately. To be certain, there are large concentrations in New York, Chicago, Los Angeles, and other major metropolitan areas. But there are also surprising pockets of strength in Midwestern cities like Minneapolis, Cleveland, and Indianapolis were great families like Dayton, Gund, and Lilly have had an enduring impact upon the cultural landscape of their hometowns. These visionary philanthropists dedicated their life’s fortunes to the well-being of their hometowns. And new foundations are being created weekly to provide the same transformational opportunities in places like Charlotte, Cincinnati, and Milwaukee. But not in central Ohio yet.
In some cases, benefactors establish foundations or entrust their assets to a community foundation with clear instructions that the proceeds are to support specific organizations each year—the art museum, or the symphony. That’s what Marie Aull did, when she established a $1 million fund at the Dayton Community Foundation to endow the local Audubon Center. Mrs. Aull and her late husband owned a business that manufactured paper boxes.
In other instances, the donor’s intentions are more general, providing a foundation’s staff and trustees with the flexibility to reward exceptional performance and/or attend to a struggling organization’s needs on a case by case basis. Sarah Belk Gambrell, whose family built the Belk’s Department Store chain, devotes nearly one-fourth of her foundation’s giving to support a variety of arts organizations in the greater Charlotte area.
Whether a foundation is devoted to a specific arts organization or dedicated to the arts in general is immaterial. The former will sustain a community’s time-honored organizations; the latter will reward innovation. The result is an overall increase in the creative capital available to ensure a vibrant arts environment and cultivate a productive creative class.
Conclusion: Does Creative Capital Matter?
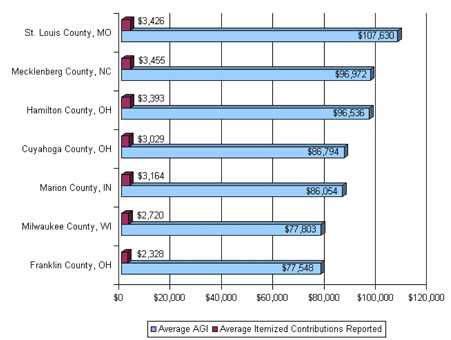
The statistics clearly demonstrate that Columbus lacks the creative capital enjoyed by other cities but what impact might that disadvantage have on wealth and philanthropy? It’s too soon to tell but the statistics do show that Columbus is clearly lagging in the creation of personal wealth and the philanthropy it provides. In cities with robust arts scenes, more than 2% of households enjoy a net worth greater than $1 million. In Cleveland, that means that there are more than 22,000 affluent households. Once again, Columbus lags the field of comparable cities, with only 12,000 affluent households—just 1.8% of all families.Across the country, affluent households provided 112 gifts of $1 million or more for the arts in 2004, but none was reported in Columbus. The discrepancy is reinforced by a comparison of overall charitable giving among the households in each city. Across the country—and in the seven cities included in this study—households that report charitable gifts on their tax returns have a significantly higher adjusted gross income (AGI) than households that do not report charitable gifts. Again, Columbus ranks at the bottom with the lowest average adjusted gross income on itemized returns reporting charitable contributions ($77,548) and the lowest average itemized contributions reported per household ($2,328).
Why is Columbus lagging in wealth generation and the philanthropy that it enables? Are we failing to attract a wealth-producing creative class? This data alone cannot support a cause/effect conclusion but the clear correlation between creative capital, affluence, and philanthropy bears further investigation. And, it demonstrates that Columbus relies on a relatively small pool of affluent households that have the capacity to turn this tide and increase access to creative capital by expanding arts endowments or establishing foundations that support the arts.
Who will take the lead in building creative capital for Columbus? National trends suggest it will be someone who calls Columbus “home” and whose family founded a successful enterprise here. It will be a person who has been inspired by music, dance, exhibitions, or other artistic expressions, and whose business was able to attract and retain employees because they found that Columbus met their financial, educational, and creative needs. Perhaps it will be the legacy of our community’s well known families, or it may be an anonymous “millionaire next door.” Whoever it is, he or she will be a visionary who will calculate the return on his or her investment not only in financial measures, but by the rising tide of creative capital that ensures Columbus residents the quality of life that results from a vibrant creative class enjoying a robust arts scene.
Endnotes
Methodology
A project such as this is a balancing act. How much data is needed to support meaningful conclusions and when does additional data merely overwhelm interpretation? When is absolute precision a requirement, and what margin of error is acceptable?
In gathering and analyzing information for this study, we attempted to achieve an appropriate balance, given the challenges. At times, we were willing to accept problematic data (as described below) when we felt the overall impressions were accurate. Just as an impressionist painting can sometimes be more revealing than a sharply focused photograph, we have made every attempt to ensure the judgment calls we were forced to make led to a fair and balanced comparative analysis.
Organizational data: Financial information on the nonprofit organizations in each city was obtained primarily from GuideStar, a national nonprofit organization that provides data from IRS Forms 990, the information tax return required of most nonprofit corporations.
We began by identifying arts and culture organizations within a five-mile radius of each target city using NTEE codes (The National Taxonomy of Exempt Entities assigns a code number to each nonprofit organization, depending on its type of activity.) We defined the search criteria for organizations generally considered “arts” or “culture,” eliminating zoos, nature centers, colleges of art, and other entities that might artificially inflate the statistics. Data came from the most recent IRS 990 available, including total income, total expenses, and assets. Most of the records were for the 2003 tax year, although a few were from 2002 or 2004.
We encountered some variances in the way nonprofit organizations report assets, making it difficult to pinpoint the precise value of endowments. In discussions with nonprofit financial officers, we learned that endowment might be indicated in one (or more) of several fields on the IRS 990, including unrestricted, permanently restricted, or temporarily restricted assets; or even in another part of the form as securities. Furthermore, non-endowment assets such as buildings and collections might be mingled with endowment assets in these same fields. On the other hand, some nonprofits have complex business structures and do not report endowed funds on their organization’s IRS 990; instead, there is a separate entity—usually a supporting foundation—with a completely different NTEE code number. In these cases, the data is reflected with foundations rather than organizations. As a result, we knew the data from the IRS 990 overstated endowment values in some cases and missed endowments entirely for other organizations.
The reporting of total income and expense may also be misleading, although these statistics played only a minor role in our analysis. Institutions that are in the midst of a capital campaign are required to report the entire value of a pledge as income in the year the pledge is received, which artificially inflates the revenue picture for these organizations.
To minimize these discrepancies, we contacted the local arts council in each community and asked them to review the data from their city. This allowed us to identify the most obvious anomalies, such as GuideStar’s omission of the Cleveland Museum of Art’s endowment which we included. We also adjusted the income, expenses, and assets of each city’s arts council, to eliminate double counting of the “pass through” funds reflected in the budgets of the arts organizations they support. In a few cases, we contacted nonprofit organizations directly or consulted their web sites when further clarification was needed. There were also seven arts and culture organizations reported by GuideStar that, because of how they function, were more appropriately placed in the Foundation listings. These are listed at the bottom of the foundation tables and are separated from the other foundations by a bold line.
Foundation data: Obtaining financial data for foundations was somewhat more precise, though not without challenges. Again, we began by consulting a national information resource: the Foundation Center. We used their searchable database to develop a list of all foundations in each city that had a self-identified interest in arts, museums, or culture. This search also yielded each foundation’s total assets and total giving. (Note: in the case of Charlotte, we included several foundations located throughout the state, given the unique philanthropic environment in that state.) Occasionally, a foundation’s giving exceeded its assets, indicating that the foundation is used as a pass-through; therefore, we counted giving rather than assets in our calculation of creative capital. To this data we added the supporting foundations of nonprofit organizations, as mentioned above.
We then isolated the amount that each foundation devoted to arts and culture by reviewing each foundation’s gifts as reported on their foundation web site and/or in their IRS 990. Although this process was labor-intensive, it provided accurate information in most instances. In a few cases, the foundation’s reports were so extensive (or so disorganized) that we were unable to separate their gifts to arts and culture, and instead estimated their giving to arts and culture by multiplying their total giving by 11.8%—the average amount that foundations devote to arts and culture nationally.
Other information: We also sought a variety of other facts to help illuminate the data from organizations and foundations, as follows:
• Population statistics: “U.S. Census Bureau; Census 2000 Data for the States of Indiana, Missouri, North Carolina, Ohio, Wisconsin: Population, Housing Units, Area, and Density Table: State by County; http://www.census.gov/census2000/states/; (accessed: April 2005).”
• Affluence: the list is based on the discretionary spending power of affluent consumers, those in the top 20 percent of U.S. households in terms of wealth and income. Created expressly for marketing to the affluent and developed from the best available data on assets and income by the national marketing data firm Echelon.
• Individual Giving: Data is based on an analysis of actual 1040 tax returns conducted by the National Center on Charitable Statistics in 1997. NCCS is currently updating this data using 2002 tax filings.

