Giving USA, the longest-running report of charitable giving in the United States, is an important tool for nonprofit professionals to understand what is happening across the sector. The latest Giving USA report shows a stellar year for philanthropy.
Inside the numbers
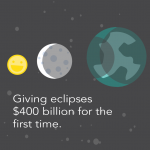 Giving rose to its highest ever levels at $410.02 billion in 2017 contributions, an increase of 5.2% over last year. This was the eighth consecutive year of growth.
 Giving as a percentage of gross domestic product (GDP) kept its six-year streak of 2.1%.
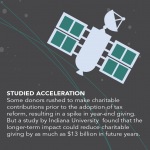 There was a spike in year-end giving as donors rushed to make charitable contributions prior to the adoption of tax reform.
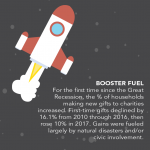 First-time gifts showed a declining trend of 16.1% from 2010 through 2016. However, it rose 10% in 2017, largely due to natural disasters and/or civic involvement.
 “Rage-donations” emerged in 2016, the middle-class answer to a protest. The trend resulted in an unknown number of new or increased gifts for 2017.
Columbus nonprofit leaders gather to discuss results
 Many nonprofit leaders and philanthropic funders from Columbus, including the Benefactor team, gathered at The Columbus Foundation last week to hear the results from the publication. Dr. Una Osili, economist and lead researcher for the report spoke at the event. The publication, which is produced out of the Lilly Family School of Philanthropy at Indiana University, is widely considered the leading report on the sources and uses of philanthropic giving.
“Giving is growing more concentrated among the wealthiest American households – and that’s not a good trend for the future. By some estimates just 3% of households give 65% of the total amount given,” said Laura MacDonald, CFRE, President of Benefactor Group. Laura was part of a panel group at the event, where she discussed some of the factors that may be “disrupting” charitable giving including rage donations, giving in response to disasters, the decline in religious affiliation and religious giving, and the rise of the door advised fund.
For more insights to serve the common good download our full infographic or request your copy to be mailed to you free of charge.

